Time History Energy Graph
Print out the energy results graph for isolator and vibration control device in the nonlinear time history analysis.
From the Main Menu select Results > Time History > Time History Graph/Text > Time History Energy Graph.
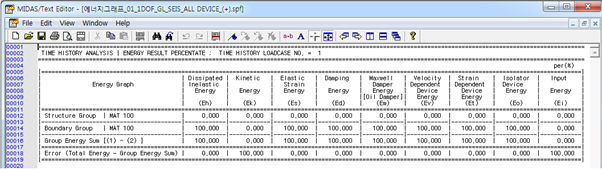
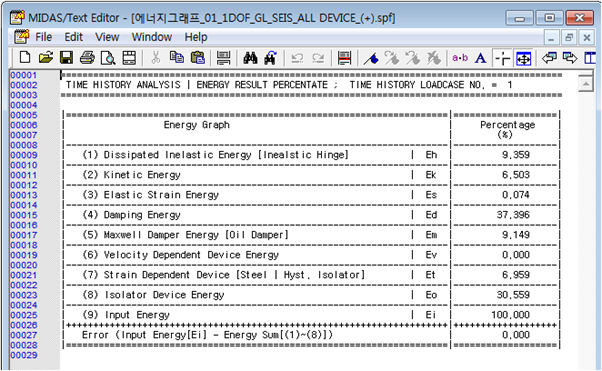
 Structure Energy Graph
Graph of the all type of energy which is applied on the structure.
 |
|
|
|
Using Context Manu, graph format can be modified. Graph can be saved as image, text, and Excel format.
Change Title & Label: Modify the title and legend of the graph. Zoom Out & Zoom Out All: Drag the graph to enlarge or restore into the original graph. Change Graph Range: Set the range of the horizontal - vertical axis of the graph by automatic setting or custom range setting. Change Graph Range: Set the range of the horizontal - vertical axis of the graph by automatic set or custom range setting. Save Graph As Image: Save the graph as image format. (BMP, JEPG, Enhanced Metafile) (Default format = BMP image) Save Graph As Text: Save the data as text format. Save Graph As Excel: Save the data as Excel format.
|


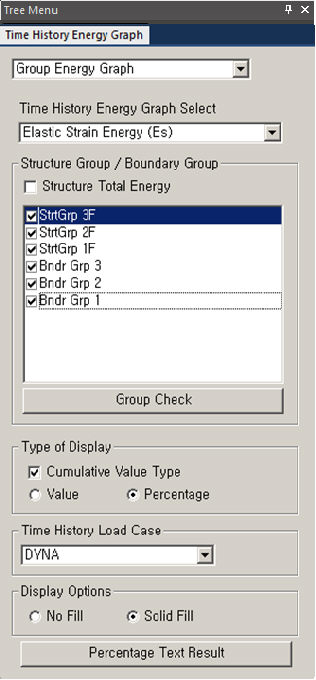
Group Energy Graph
Group energy graph which users define by story, by member, by type.
 |
|
|
|
Using Context Manu, graph format can be modified. Graph can be saved as image, text, and Excel format.
Change Title & Label: Modify the title and legend of the graph. Zoom Out & Zoom Out All: Drag the graph to enlarge or restore into the original graph. Change Graph Range: Set the range of the horizontal - vertical axis of the graph by automatic setting or custom range setting. Change Graph Range: Set the range of the horizontal - vertical axis of the graph by automatic set or custom range setting. Save Graph As Image: Save the graph as image format. (BMP, JEPG, Enhanced Metafile) (Default format = BMP image) Save Graph As Text: Save the data as text format. Save Graph As Excel: Save the data as Excel format.
|